Excel 2007
Creating automatically extended plot ranges
If you often need to adjust your data ranges so that your charts plot an updated data range, you may be
interested in a trick that forces Excel to update the chart's data range whenever you add new data to your
worksheet.
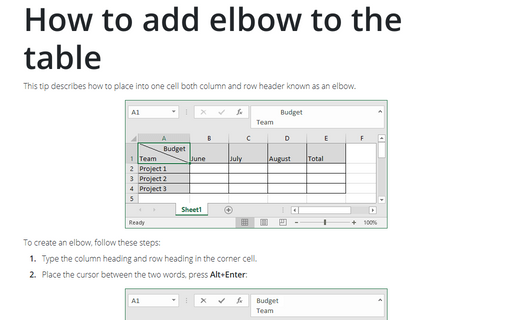
How to add elbow to the table
This tip describes how to place into one cell both column and row header known as elbow.
Viewing a worksheet in multiple windows
Sometimes, you may want to view two different parts of a worksheet simultaneously - perhaps to make it
easier to reference a distant cell in a formula. Or you may want to examine more than one sheet in the same
workbook simultaneously.
Removing excess spaces and nonprinting characters
Often, data imported into an Excel worksheet contains excess spaces or strange (often unprintable)
characters. There are two handy functions TRIM and CLEAN to cleanup such data.
Creating Pie of Pie and Bar of Pie charts
If you have several parts of something whole, you can demonstrate each item in one pie chart. But, when
several parts each amount to less than 10 percent of the pie, it becomes hard to distinguish the slices.
Combining several charts into one chart
If you want to combine more than two different data series with common horizontal and different vertical
values, you could not just add another axis to the chart. You need to combine several charts into one chart.
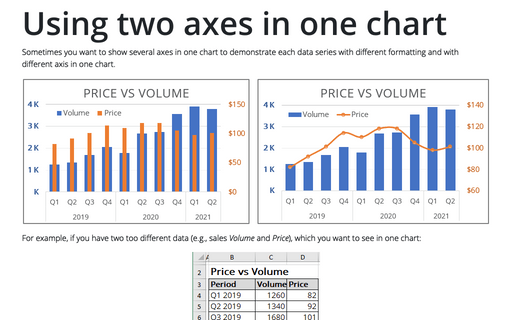
Using two axes in one chart
Sometimes you want to show several axes in one chart in order to demonstrate each data series with different
formatting and with different axis in one chart.
Create a toolbar button or menu item to run a Macro
If you assigned a key combination to a macro when you recorded it, you can run the macro by pressing that
key combination. If not, you can subsequently assign the macro to the menu item.
Excel 3-D Pie charts
This tip is about how to create a pie chart such as in popular glossy magazines.
How to add deviations into your chart
Sometimes you can give your charts more impressive view by showing deviations of some real process from its
expected flow.


