Excel 2007
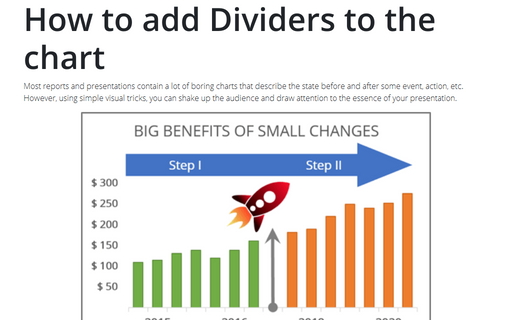
How to add Dividers to the chart
Most reports and presentations contain a lot of boring charts that describe the state before and after some
event, action, etc. However, using simple visual tricks you can shake up the audience and draw an attention
to the essence of your presentation.
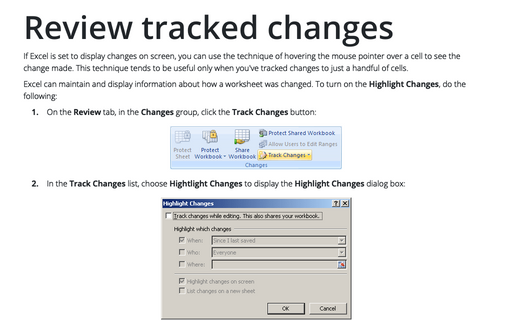
Review tracked changes
If Excel is set to display changes on screen, you can use the technique of hovering the mouse pointer over a
cell to see the change made. This technique tends to be useful only when you've tracked changes to just a
handful of cells.
Using Pie Charts and Doughnut Charts in Excel
If you have several parts of something one, you can demonstrate each item in one pie chart. But sometimes
you want to demonstrate the changes of those parts and doughnut chart will help you to do this.
Using shortcut keys to create a chart
Excel propose easy and very fast way to create a chart by using shortcut keys.
Saving workbooks
Saving your document in the same location with the same name is easy.
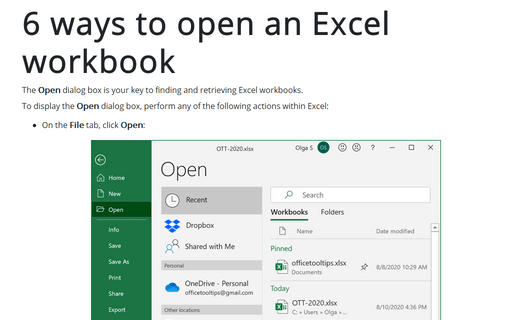
6 ways to open an Excel workbook
The Open dialog box, is your key to finding and retrieving Excel workbooks.
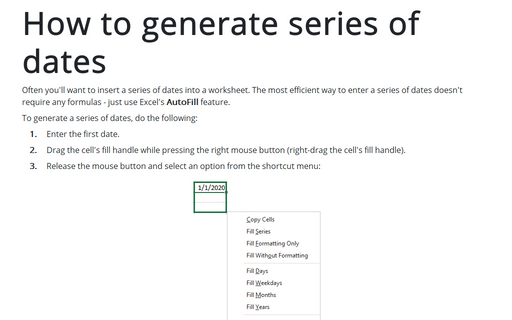
How to generate series of dates
Often you'll want to insert a series of dates into a worksheet. The most efficient way to enter a series of
dates doesn't require any formulas - just use Excel's AutoFill feature.
Using Solver
Solver tool allows you to specify multiple adjustable cells and constraints on the values that the
adjustable cells can have, generate a solution that maximizes or minimizes a particular worksheet cell,
generate multiple solutions to a problem.
Calculating the number of work days between two dates
When calculating the difference between two dates, you may want to exclude weekends and holidays.
Record a Macro using the Macro Recorder
The easiest way to create a macro in Excel is to use Office's built-in Macro Recorder tool.


