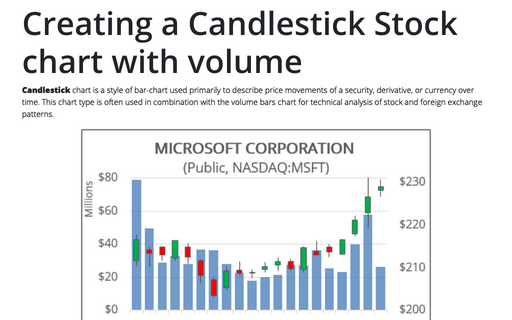
Creating a Candlestick Stock chart

To create a Candlestick chart in Excel 2003, do the following:
1. Depending on the type of stock chart you want to create, you must include a specific combination of data series in your worksheet - and put the data series in order:
- High-Low-Close:
- High price
- Low price
- Closing price
- Open-High-Low-Close:
- Opening price
- High price
- Low price
- Closing price
- Volume-High-Low-Close:
- Volume traded
- High price
- Low price
- Closing price
- Volume-Open-High-Low-Close:
- Volume traded
- Opening price
- High price
- Low price
- Closing price
2. Insert column before column Day and paste the = DAY () formula.
3. Select the data range (in this example D5:G26, the data from Google Finance):

4. Choose Insert -> Chart... to open the Chart Wizard dialog box:

5. Choose the Stock type, the Open-High-Low-Close sub-type and then click Next >.
For a quick preview of the chart you are creating, click Press and Hold to View Sample.

6. In the Step 2 of Chart Wizard, check the data in the Series tab, enter the Category (X) axis labels data (in this example A5:A26) and click Next >.

7. In the Step 3 of Chart Wizard, in the Titles tab, enter the chart title, hide the legend in the Legend tab, and then click Next >.
8. In the Step 4 of Chart Wizard, click the Finish button:

You can then make any other adjustments to get the look you desire.


