Format in Excel 365
Customize the vertical axis labels
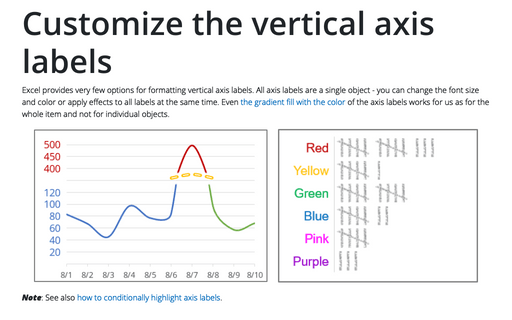
Excel provides very few options for formatting vertical axis labels. All axis labels are a single object - you can change the font size and color or apply effects to all labels at the same time. Even the gradient fill with the color of the axis labels works for us as for the whole item and not for individual objects.
Customize the horizontal axis labels
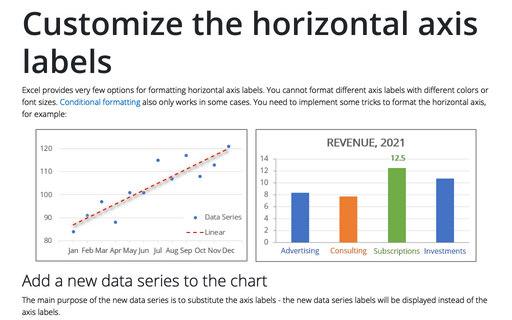
Excel provides very few options for formatting horizontal axis labels. You cannot format different axis labels with different colors or font sizes. Conditional formatting also only works in some cases. You need to implement some tricks to format the horizontal axis, for example:
How to add an axis pointer
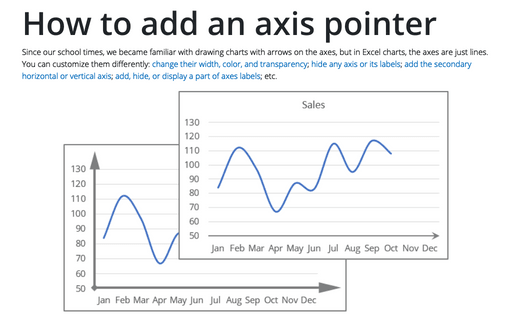
Since our school times, we became familiar with drawing charts with arrows on the axes, but in Excel charts, the axes are just lines. You can customize them differently: change their width, color, and transparency; hide any axis or its labels; add the secondary horizontal or vertical axis; add, hide, or display a part of axes labels; etc.
How to change axis labels order in a bar chart
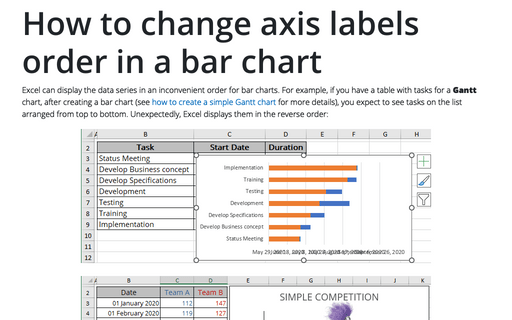
Excel can display the data series in an inconvenient order for bar charts. For example, if you have a table with tasks for a Gantt chart, after creating a bar chart (see how to create a simple Gantt chart for more details), you expect to see tasks on the list arranged from top to bottom. Unexpectedly, Excel displays them in the reverse order:
How to freeze charts, shapes, text boxes, and other objects in Excel
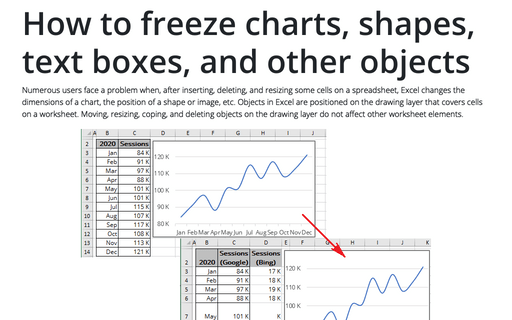
Numerous users face a problem when, after inserting, deleting, and resizing some cells on a spreadsheet, Excel changes the dimensions of a chart, the position of a shape or image, etc. Objects in Excel are positioned on the drawing layer that covers cells on a worksheet.
How to select an invisible element in the chart
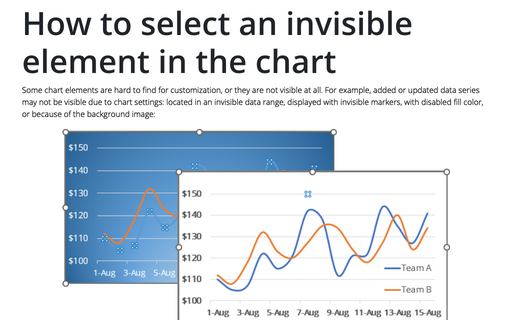
Some chart elements are hard to find for customization, or they are not visible at all. For example, added or updated data series may not be visible due to chart settings: located in an invisible data range, displayed with invisible markers, with disabled fill color, or because of the background image:
How to change format for diagram shapes in Excel
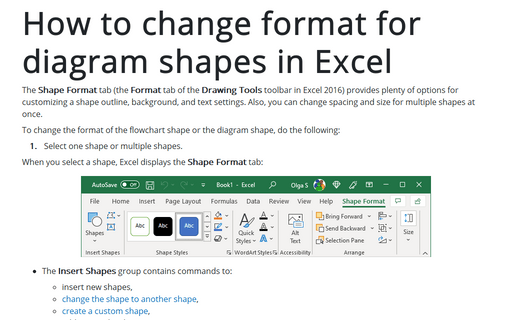
The Shape Format tab (the Format tab of the Drawing Tools toolbar in Excel 2016) provides plenty of options for customizing a shape outline, background, and text settings. Also, you can change spacing and size for multiple shapes at once.
Set page margins
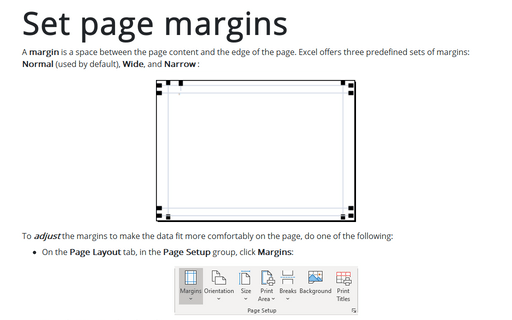
A margin is a space between the page content and the edge of the page. Excel offers three predefined sets of margins: Normal (used by default), Wide, and Narrow :
Change the page orientation
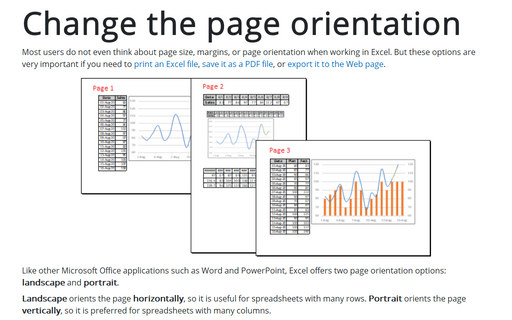
Most users do not even think about page size, margins, or page orientation when working in Excel. But these options are very important if you need to print an Excel file, save it as a PDF file, or export it to the Web page.
Excel AutoComplete to automate data entry
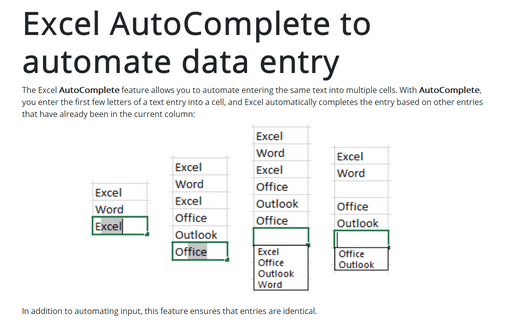
The Excel AutoComplete feature allows you to automate entering the same text into multiple cells. With AutoComplete, you enter the first few letters of a text entry into a cell, and Excel automatically completes the entry based on other entries that have already been in the current column:
