Format in Excel 365
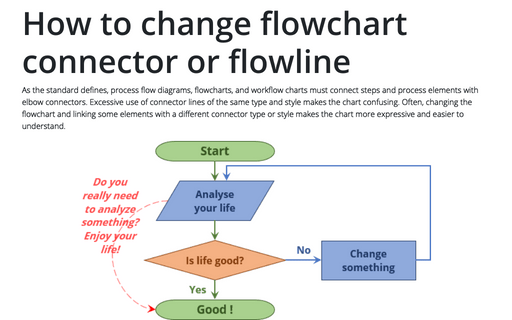
How to change flowchart connector or flowline
As the standard defines, process flow diagrams, flowcharts, and workflow charts must connect steps and process elements with elbow connectors. Excessive use of connector lines of the same type and style makes the chart confusing. Often, changing the flowchart and linking some elements with a different connector type or style makes the chart more expressive and easier to understand.
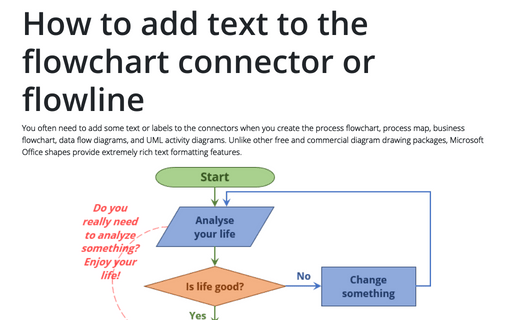
How to add text to the flowchart connector or flowline
You often need to add some text or labels to the connectors when you create the process flowchart, process map, business flowchart, data flow diagrams, and UML activity diagrams. Unlike other free and commercial diagram drawing packages, Microsoft Office shapes provide extremely rich text formatting features.
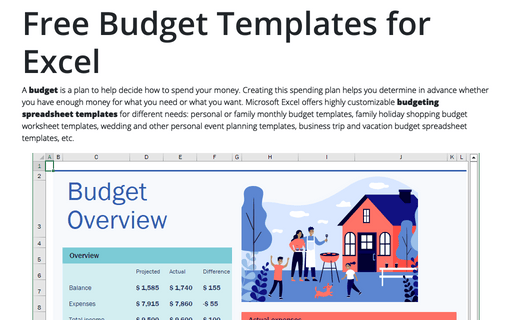
Free Budget Templates for Excel
A budget is a plan to help decide how to spend your money. Creating this spending plan helps you determine in advance whether you have enough money for what you need or what you want. Microsoft Excel offers highly customizable budgeting spreadsheet templates for different needs: personal or family monthly budget templates, family holiday shopping budget worksheet templates, wedding and other personal event planning templates, business trip and vacation budget spreadsheet templates, etc.
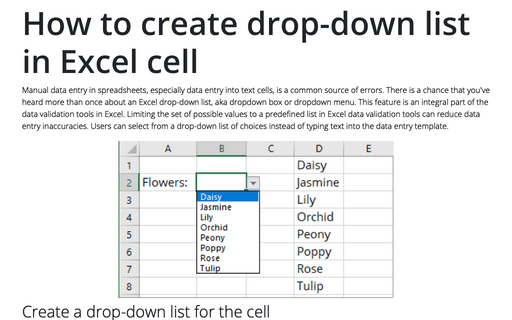
How to create drop-down list in Excel cell
Manual data entry in spreadsheets, especially data entry into text cells, is a common source of errors. There is a chance that you've heard more than once about an Excel drop-down list, aka dropdown box or dropdown menu. This feature is an integral part of the data validation tools in Excel. Limiting the set of possible values to a predefined list in Excel data validation tools can reduce data entry inaccuracies. Users can select from a drop-down list of choices instead of typing text into the data entry template.
How to use Camera tool in Excel
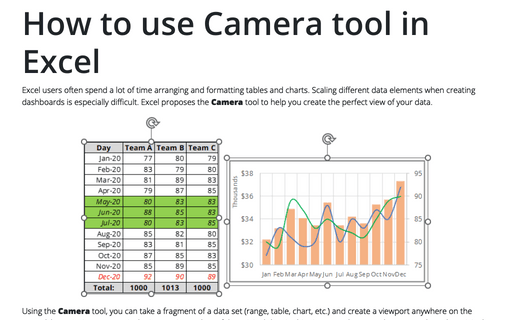
Excel users often spend a lot of time arranging and formatting tables and charts. Scaling different data elements when creating dashboards is especially difficult. Excel proposes the Camera tool to help you create the perfect view of your data.
Waterfall chart
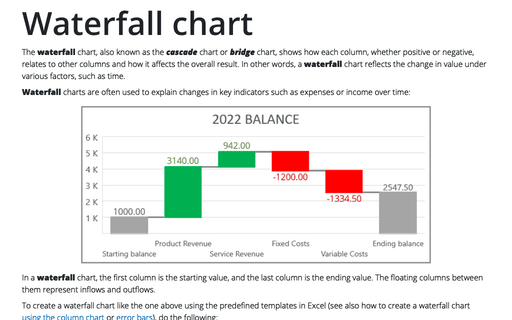
The waterfall chart, also known as the cascade chart or bridge chart, shows how each column, whether positive or negative, relates to other columns and how it affects the overall result. In other words, a waterfall chart reflects the change in value under various factors, such as time.
How to view geography information in Excel
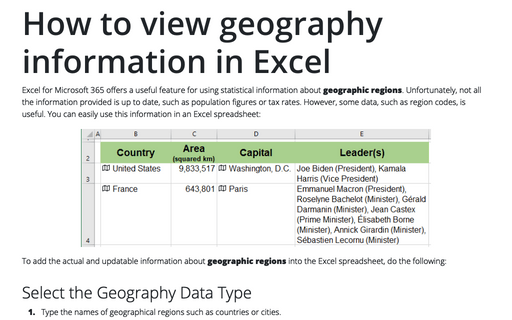
Excel for Microsoft 365 offers a useful feature for using statistical information about geographic regions. Unfortunately, not all the information provided is up to date, such as population figures or tax rates. However, some data, such as region codes, is useful. You can easily use this information in an Excel spreadsheet:
How to view currency exchange rates in Excel
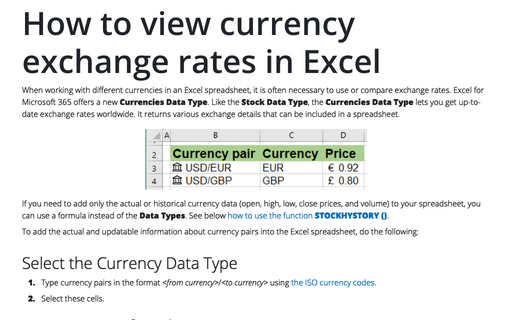
When working with different currencies in an Excel spreadsheet, it is often necessary to use or compare exchange rates. Excel for Microsoft 365 offers a new Currencies Data Type. Like the Stock Data Type, the Currencies Data Type lets you get up-to-date exchange rates worldwide. It returns various exchange details that can be included in a spreadsheet.
How to view historical stock prices and currency rates in Excel
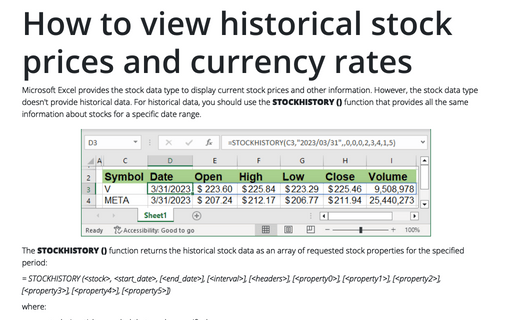
Microsoft Excel provides the stock data type to display current stock prices and other information. However, the stock data type doesn't provide historical data. For historical data, you should use the STOCKHISTORY () function that provides all the same information about stocks for a specific date range.
How to view current stock prices and other quotes in Excel
There are countless reasons why you might need actual stock information, such as stock prices and changes, in your Excel spreadsheet. Previously, you had to copy and paste from Yahoo Finance or another financial service.
